
Parents’ annual income lacks statistical significance as a predictor of state SAT scores when additional variables are well controlled. Spearman rank correlation coefficients reveal parents’ income to be a weaker predictor of average SAT scores for each income bracket within each state than parents’ education level as a predictor of average SAT scores for each education level within each state. Multiple linear regression of state SAT scores with covariates for sample size, state participation, year, and each possible combination of ordinal variables for parents’ income, parents’ education, and race shows income to lack statistical significance in 49% of the iterations with greater frequency of insignificance among iterations with higher explained variance. Cohen’s d comparisons of the yearly individual SAT advantage of having educated parents show a fairly consistently increasing positive relationship over time, whereas similar analysis of the yearly individual SAT advantage of having high-income parents shows variability somewhat coinciding with the business cycle.
Read the whole study at Open Differential Psychology.
See below for important excerpts and extra super-awesome graphs.
“Sackett et al (2009) recounted a series of accusations that the SAT merely measures family wealth. The College Board’s announcement of 2016 SAT reforms has stirred anew claims that 'the only persistent statistical result from the SAT is the correlation between high income and high test scores' (Botstein, 2014). Thus, income as an important predictor of SAT scores somewhat fits a view critical of the SAT, which is that financial resources and class privilege unduly enable higher SAT achievement. If the education component of socioeconomic status dominates over the income component, then the relationship between socioeconomic status and scores might instead more accurately reflect a family’s values towards education and a hereditary influence shared between test performance and educability.”
“This study seeks to thoroughly parse the effects of multiple covariates, including family income, parents’ highest education level, and potential confounding variables specific to state or multiple-year comparisons. To do this, full advantage will be taken from all sixteen years of state data.”

Income p-values without race as a covariate (p-values are shown on an inverse logarithmic scale)

Income p-values with race as a covariate (p-values are shown on an inverse logarithmic scale)
“The racial variable was the most consistently significant variable of these three ordinal variables for composite scores and subtests, which speaks to its independence from socioeconomic status. Race also explained much of the SAT advantage that appeared to be attributable to parents’ income prior to the addition of the racial variable in iterations with low income thresholds simultaneous with the education cutoff being graduate degree.”


Critical-reading and mathematics standardized coefficients compared to adjusted R2 values, organized by education first, race within each educational category, and income within each racial category
“Parents’ income has a significant association with SAT scores, but parents’ education is consistently stronger, and regression with effective controls for race, education, and other factors, usually suppresses the income variable to insignificance. The income variable achieved significance when the education threshold was high school diploma most likely because so few parents were dropouts that education was no longer effectively controlled, and parents’ income became a proxy variable for parents’ education…. Part of this dominance could result from heritability in test performance corresponding to parents’ educational attainment, given the high heritability estimates from twins studies for high-stakes standardized exams in the UK and the Netherlands (Bartels et al, 2002; Shakeshaft et al, 2013).”
“Figure 1 seems to contradict Dixon- Román et al in finding that the racial variable had its greatest influence at the highest education level and at high income levels.”
“Asian Americans have historically high average mathematics subtest scores but lower verbal/critical-reading average scores than the white majority…. Despite their likely small average verbal disadvantage and small population in many states, this study’s consistent regression results for Asian race match verifiable individual SAT-score phenomena. A study with fewer observations, a much smaller represented sample, or fewer or poorly chosen covariates might not have achieved that level of definition, but, fundamentally, states do not take the SAT; people do.”
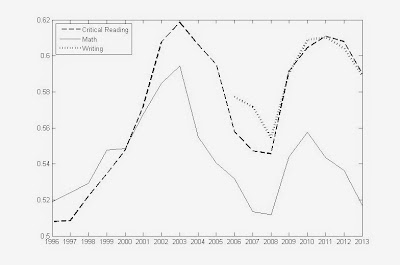
Cohen’s d SAT advantage of having parents’ annual income above $60,000
“Family educational advantage seems to evince virtually undeviating growth as a predictor of SAT scores, but financial advantage seems to grow as the economy worsens. Rather than postulate that times of economic difficulty almost immediately make wealthy people smarter, one should focus on the exclusivity of the income category…. The declining relative income advantage on the mathematics subtest compared to the critical-reading subtest also could be related to structural changes to the economy since the decline of the high-technology boom of the 1990’s, which also fits this interpretation of persistence within families.”
For those readers who do not have a heart condition, I recommend the spirited and colorful statistics debate in the open peer-review forum. One may also find there data supplements of state data that required many months of typing out the data from 816 state reports into a database, which makes a fun toy.
nooffensebut (2014). Parents’ Income is a Poor Predictor of SAT Score Open Differential Psychology, 1-19
Ariel Investments. (2010). The Ariel Investments 2010 black investor survey: Saving and investing among higher income African-American and white Americans. Retrieved April 1, 2014 from http://www.arielinvestments.com/landmark-surveys/
Balf, T. (2014). The story behind the SAT overhaul. New York Times. Retrieved March 25, 2014 from http://www.nytimes.com/2014/03/09/magazine/the-story-behind-the-sat-overhaul.html.
Bartels M, Rietveld MJ, Van Baal GC, & Boomsma DI (2002). Heritability of educational achievement in 12-year-olds and the overlap with cognitive ability. Twin research : the official journal of the International Society for Twin Studies, 5 (6), 544-53 PMID: 12573186
Botstein, L. (2014). College president: SAT is part hoax, part fraud. Time. Retrieved March 25, 2014 from http://time.com/15199/college-president-sat-is-part-hoax-and-part-fraud/.
Buchmann, C., Condron, D., & Roscigno, V. (2010). Shadow Education, American Style: Test Preparation, the SAT and College Enrollment Social Forces, 89 (2), 435-461 DOI: 10.1353/sof.2010.0105
Dixon-Román, E.J., Everson, H.T., & McArdle, J.J. (2013). Race, poverty and SAT scores: Modeling the influences of family income on black and white high school students’ SAT performance. Teachers College Record, 115 (4), 1-33
Duckworth AL, Quinn PD, Lynam DR, Loeber R, & Stouthamer-Loeber M (2011). Role of test motivation in intelligence testing. Proceedings of the National Academy of Sciences of the United States of America, 108 (19), 7716-20 PMID: 21518867
Duncan, J., Seitz, R.J., Kolodny, J., Bor, D., Herzog, H., Ahmed, A., Newell, F.N., & Emslie, H. (2000). A Neural Basis for General Intelligence Science, 289 (5478), 457-460 DOI: 10.1126/science.289.5478.457
Everson, H.T., and Millsap, R.E. (2004). Beyond individual differences: Exploring school effects on SAT scores. (RR-2004-3). New York: College Board.
MacCallum RC, Wegener DT, Uchino BN, & Fabrigar LR (1993). The problem of equivalent models in applications of covariance structure analysis. Psychological bulletin, 114 (1), 185-99 PMID: 8346326
Marioni RE, Davies G, Hayward C, Liewald D, Kerr SM, Campbell A, Luciano M, Smith BH, Padmanabhan S, Hocking LJ, Hastie ND, Wright AF, Porteous DJ, Visscher PM, & Deary IJ (2014). Molecular genetic contributions to socioeconomic status and intelligence. Intelligence, 44 (100), 26-32 PMID: 24944428
Neter, J., Wasserman, W., and Kutner, M.H. (1983). Applied Linear Regression Models. Homewood, IL: Richard D. Irwin, Inc.
Prescott, B.T., and Bransberger, P. (2012). Knocking at the College Door: Projections of High School Graduates (eighth edition). Boulder, CO: Western Interstate Commission for Higher Education.
Sackett PR, Kuncel NR, Arneson JJ, Cooper SR, & Waters SD (2009). Does socioeconomic status explain the relationship between admissions tests and post-secondary academic performance? Psychological bulletin, 135 (1), 1-22 PMID: 19210051
Sackett PR, Kuncel NR, Beatty AS, Rigdon JL, Shen W, & Kiger TB (2012). The role of socioeconomic status in SAT-grade relationships and in college admissions decisions. Psychological science, 23 (9), 1000-7 PMID: 22858524
Schmitt N, Keeney J, Oswald FL, Pleskac TJ, Billington AQ, Sinha R, & Zorzie M (2009). Prediction of 4-year college student performance using cognitive and noncognitive predictors and the impact on demographic status of admitted students. The Journal of applied psychology, 94 (6), 1479-97 PMID: 19916657
Shakeshaft NG, Trzaskowski M, McMillan A, Rimfeld K, Krapohl E, Haworth CM, Dale PS, & Plomin R (2013). Strong genetic influence on a UK nationwide test of educational achievement at the end of compulsory education at age 16. PloS one, 8 (12) PMID: 24349000
Trzaskowski M, Harlaar N, Arden R, Krapohl E, Rimfeld K, McMillan A, Dale PS, & Plomin R (2014). Genetic influence on family socioeconomic status and children's intelligence. Intelligence, 42 (100), 83-88 PMID: 24489417
US Census Bureau. (1990). Asians and Pacific Islanders in the United States. Retrieved March 23, 2014 from https://www.census.gov/prod/cen1990/cp3/cp-3-5.pdf.
US Census Bureau. (2013). Asian/Pacific American Heritage Month: May 2013. Retrieved March 24, 2014 from https://www.census.gov/newsroom/releases/pdf/cb13ff-09_asian.pdf.


2 comments:
Your article is not indexed in Google Scholar. I think the reason could be the name "nooffensebut". I have explained the reason here.
It seems you need at least two names in your name. Perhaps if you try "no offense but" or "no offensebut" GS would accept it.
Probably for similar reasons, Dalliard also had problems with this. He has asked Emil to make the appropriate changes.
You can also ask Emil to change the link of the submitted paper, by uploading a new one, with the new name/pseudonym.
Any paper in a given journal should be indexed, otherwise, it's a great loss.
Thank you.
Post a Comment